Key Takeaway:
The US imposition of sweeping reciprocal tariffs—25% on Indian imports and an additional 10% on any country aligned with “anti-American” BRICS policies—marks a pivotal shift in global commerce. It will accelerate intra-BRICS trade, fragment supply chains, and intensify de-dollarisation efforts. Stakeholders must prepare for a dual-track trade order and adapt strategies in finance, diplomacy, and industry resilience.
Executive Summary
The Trump administration’s July 2025 tariff measures target BRICS nations with unprecedented reciprocity. India faces a blanket 25% duty on exports to the US, with no product exemptions, while any BRICS-aligned country—Brazil, Russia, China, South Africa or their partners—risks an extra 10% penalty tariff. These policies undermine WTO norms and threaten $1 T of annual trade flows. This article provides:
- Historical context and timeline of US tariff announcements
- Detailed sectoral, macroeconomic, and geopolitical impacts for India and Russia
- BRICS bloc reaction: intra-bloc trade growth, currency swaps, and infrastructure financing
- Supply-chain realignments across regions
- US bilateral damage-control efforts
- Data-driven charts illustrating trade trends and sectoral losses
- SEO-optimised structure and keywords for Google Discover and search-snippet ranking
1. Timeline & Policy Framework
July 30, 2025
- Announcement: 25% tariff on all Indian imports effective August 1 under Sections 232, 301, and IEEPA1.
August 1, 2025
- BRICS Penalty: Additional 10% tariff on countries aligning with “anti-American” BRICS policies, covering new and existing reciprocal rates.
August 7 – October 5, 2025
- Implementation: India-specific tariffs enforced August 7 for scheduled sectors; shipments in transit until October 5 charged pre-tariff rates.
Ongoing
- US negotiates partial exemptions with allies (UK, EU, Vietnam) at lower rates (15–20%), leaving BRICS exposed.
2. BRICS Trade Trends (2014–2024)
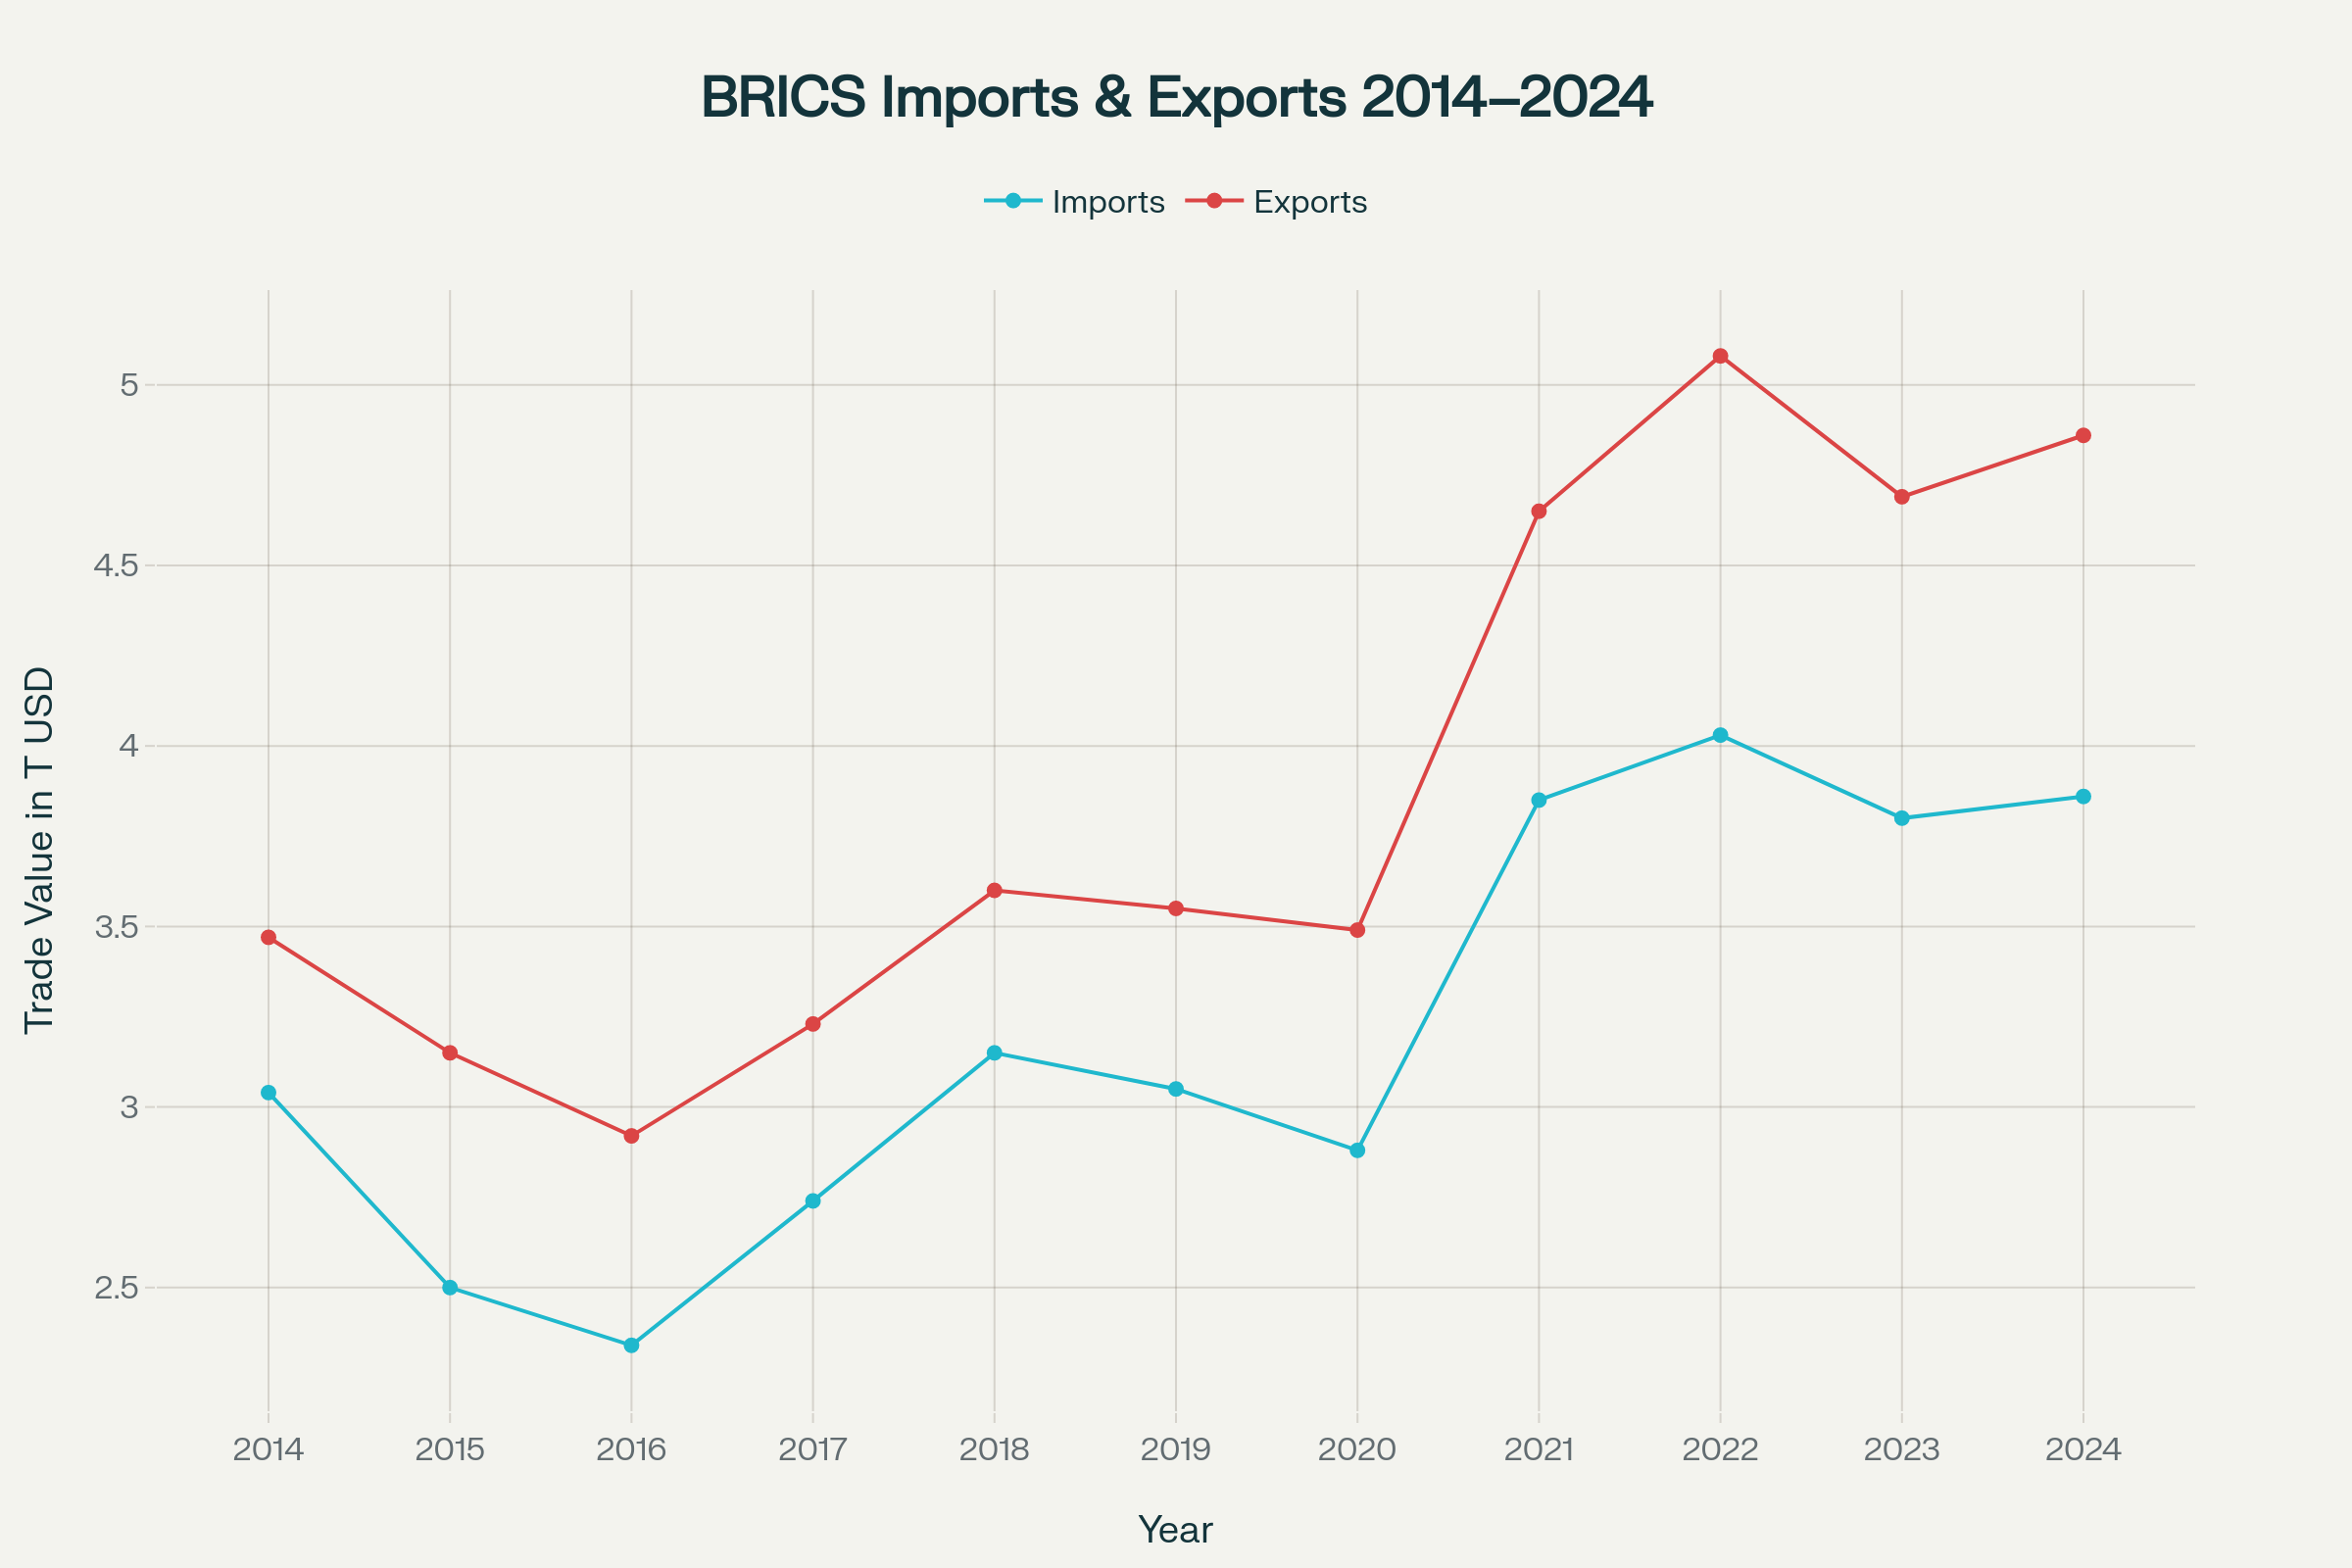
![BRICS Imports and Exports (2014–2024)]

BRICS Imports and Exports (2014–2024)
Between 2014 and 2024:
- Exports rose from $3.47 T to $5.08 T by 2022, easing to $4.86 T in 2024 as global headwinds mounted.
- Imports climbed from $3.04 T to $4.03 T by 2022, retreating to $3.86 T in 2024 amid shifting supply-chain strategies.
Key inflexion points:
- 2017–2018: Post-US–China tariff escalation; supply-chain diversification within BRICS.
- 2021–2022: Post-pandemic recovery spike.
- 2023–2024: Plateauing due to emerging trade tensions and pre-announcement of new US duties.
Data source: BRICS trade reports, 2025.
3. India: Exposure, Impacts, and Loss Estimates
3.1 Scope of Duties & Legal Basis
- Rate: 25% flat on all Indian exports, including pharmaceuticals, electronics, textiles, auto components, and energy products.
- Legal Justification: National security (Sec 232), unfair trade practices (Sec 301), and emergency powers (IEEPA).
- WTO Concerns: Potential violation of Most-Favoured-Nation (MFN) obligations and tariff bindings.
3.2 Sectoral Exports & Loss Projections
| Sector | Exports FY 2025 ($ B) | Tariff Rate | Est. Loss FY 2026 ($ B) | YoY Growth (2019–24) |
|---|---|---|---|---|
| Pharmaceuticals | 9.81 | 25% | 2.0 | +7.2% |
| Smartphones | 10.91 | 25% | 3.3 | +12.5% |
| Petroleum Products | 4.13 | 25% | 1.0 | +4.1% |
| Apparel & Textiles | 6.21 | 25% | 1.5 | +3.8% |
| Auto Components | 3.41 | 25% | 0.8 | +10.0% |
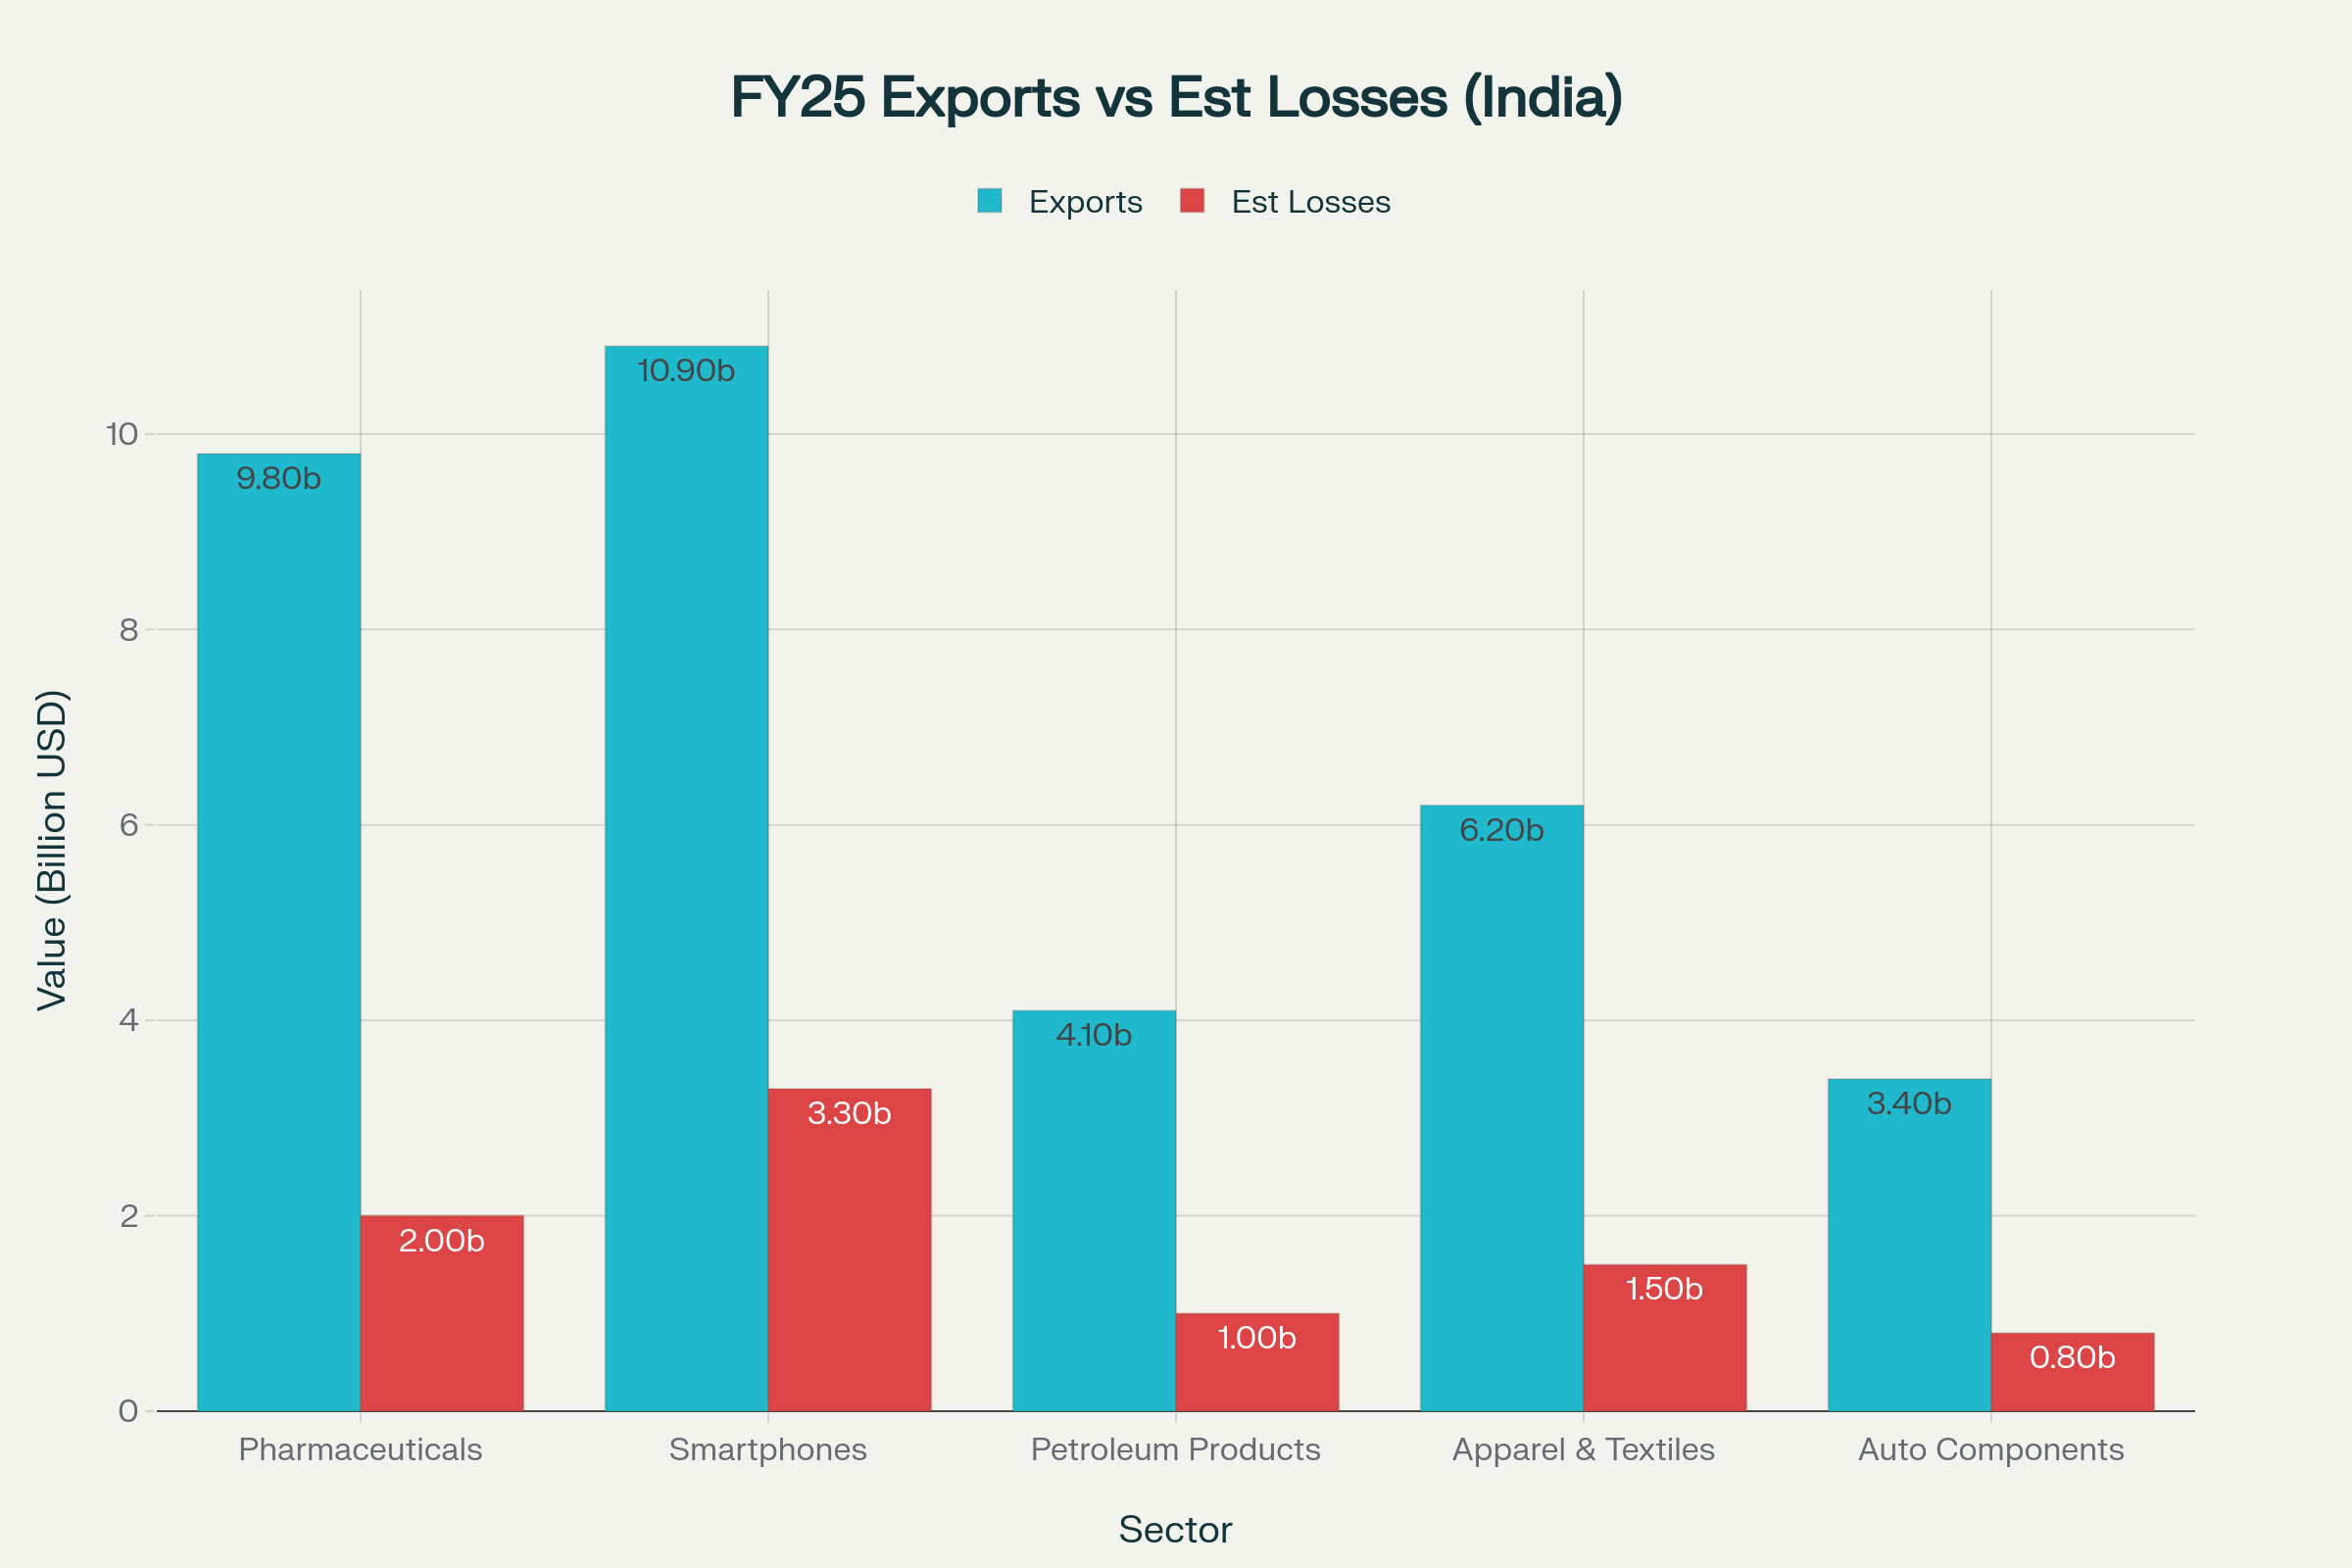
![FY2025 Indian Exports vs Estimated Losses Due to US Tariffs]

FY2025 Indian Exports vs Estimated Losses Due to US Tariffs
Chart 1: Grouped bar chart comparing FY2025 exports and estimated losses per sector.
- Total Exports at Risk: $34.4 B; Total Estimated Loss: $8.6 B (25% of export value).
- High-Risk Sectors: Smartphones (30% of sector exports), pharmaceuticals (20%).
3.3 Macroeconomic Drag
- GDP Impact: 0.40 pp reduction in FY 2026 growth from export contraction and currency depreciation.
- Employment Risk: Potential job losses up to 2 M in manufacturing sectors (textiles, auto components, electronics).
- Fiscal Effects: Lower export revenue could widen India’s fiscal deficit by 0.1–0.2 pp.
3.4 Trade Balance & Rupee Pressure
- Trade Deficit Shift: US trade deficit with India narrows from $19 B (2024) to $10 B projected.
- Currency: Rupee depreciated 3.5% against USD following tariff announcement.
4. Russia: Sanctions Overlap & Oil Leverage
4.1 Secondary Tariffs & Export Barriers
- Existing Sanctions: Russia under US/EU measures since 2014; adding tariff layers raises trade costs further6.
- Trade Volume: Russia’s exports to the US were $2.2 B in 2024; new tariffs amplify barriers across machinery, minerals, and metallurgy.
4.2 Energy Dependency & BRICS Penalty Risk
- Oil Purchases: India and China account for ~35% of Russian crude exports. A 500% tariff on energy buyers would cripple Russia’s key export revenue and disrupt energy security for BRICS consumers.
- Strategic Response: Russia shifts supply to non-US markets (Turkey, Iran) and deepens discounting for “sanctions-risk” buyers.
5. BRICS Bloc Reaction & Trade Realignment
5.1 Unified Diplomatic Push
- BRICS Declaration: Condemned unilateral tariffs, urged WTO reform, and called for multilateral dispute-resolution mechanisms.
- Joint Statements: Russia and China co-sponsored resolutions at the G20 against “weaponisation of trade policy.”
5.2 Intra-BRICS Trade Acceleration
- 2025 Growth: Projected +7% YoY vs. historic +5% average.
- Currency Swaps: $50 B in new swap lines among central banks; bilateral rupee–rand and real–yuan swaps pilot $28 B settlements.
- NDB Lending: New Development Bank committed $60 B to infrastructure spanning Africa and Eurasia.
5.3 Supply-Chain Diversification
| Region | Investment Focus | Drivers |
|---|---|---|
| Southeast Asia | Electronics, textiles | US FTAs (e.g., Vietnam), cost arbitrage |
| Africa | Mining, agriculture | Raw materials, Chinese investment |
| Latin America | Energy, infrastructure | Proximity, BRICS bank financing |
| Middle East | Petrochemicals, logistics | Strategic corridors, funding capacity |
Companies re-route sourcing, manufacturing, and logistics away from US-aligned hubs to BRICS-friendly economies.
6. US Bilateral “Damage Control”
6.1 Preferential Deals
- UK & EU: Tariff rates capped at 15 – 20% under customised agreements, conditional on service-market access.
- Vietnam & Indonesia: Secured 20% and 19% respectively, emphasising supply-chain resilience for semiconductors and palm oil4.
6.2 Negotiation Leverage
- US Demands: Enhanced IP protections, removal of non-tariff barriers in agriculture/dairy, and reciprocity in digital-services regulations.
- India Talks: FTA discussions intensify; sticking points remain GM crop approvals and dairy-market access.
6.3 Calendar
- Aug 1, 2025: Deadline for lower-rate bilateral deals.
- Q4 2025: India–US FTA negotiations.
- 2026: WTO Ministerial in India, push for tariff discipline and dispute-resolution modernisation.
7. Future Outlook & Strategic Implications
7.1 Dual-Track Trade Order
- Track A: US-centric corridor—US, EU, UK, Japan, key ASEAN partners at preferential rates.
- Track B: BRICS-centric network—deepened intra-bloc commerce, local-currency settlements, alternative infrastructure (Chinese BRI, NDB).
7.2 De-Dollarisation Momentum
- BRICS Pay & Bridge: Pilot transactions grew from $5 B in 2022 to $28 B in 2024.
- Reserve Currency Status: Russia and China bolster gold reserves; India explores rupee bonds in Eurasian markets.
7.3 Policy Recommendations for India & Russia
- Market Diversification: Expand export markets in Africa, Latin America, and MENA.
- Value-Chain Upgrading: Focus on higher-value manufacturing (pharma R&D, EVs, aerospace).
- Digital Trade Platforms: Adopt blockchain-based logistics to reduce compliance costs.
- Trade Finance: Leverage NDB and AIIB facilities for working-capital loans in local currencies.
Conclusion
The US’s aggressive tariff strategy represents a watershed moment, compelling BRICS nations to forge alternative trade and financial architectures. India and Russia must pivot toward diversified markets, boost value-chain sophistication, and accelerate de-dollarisation. As the world bifurcates into US-led and BRICS-led corridors, businesses and governments will need agile, data-driven strategies to navigate this evolving landscape.


